Trace details
Trace details keeps the operation structure, timing, and captured data together. Use it to move from a failed, slow, or expensive trace to the exact span that explains the result.
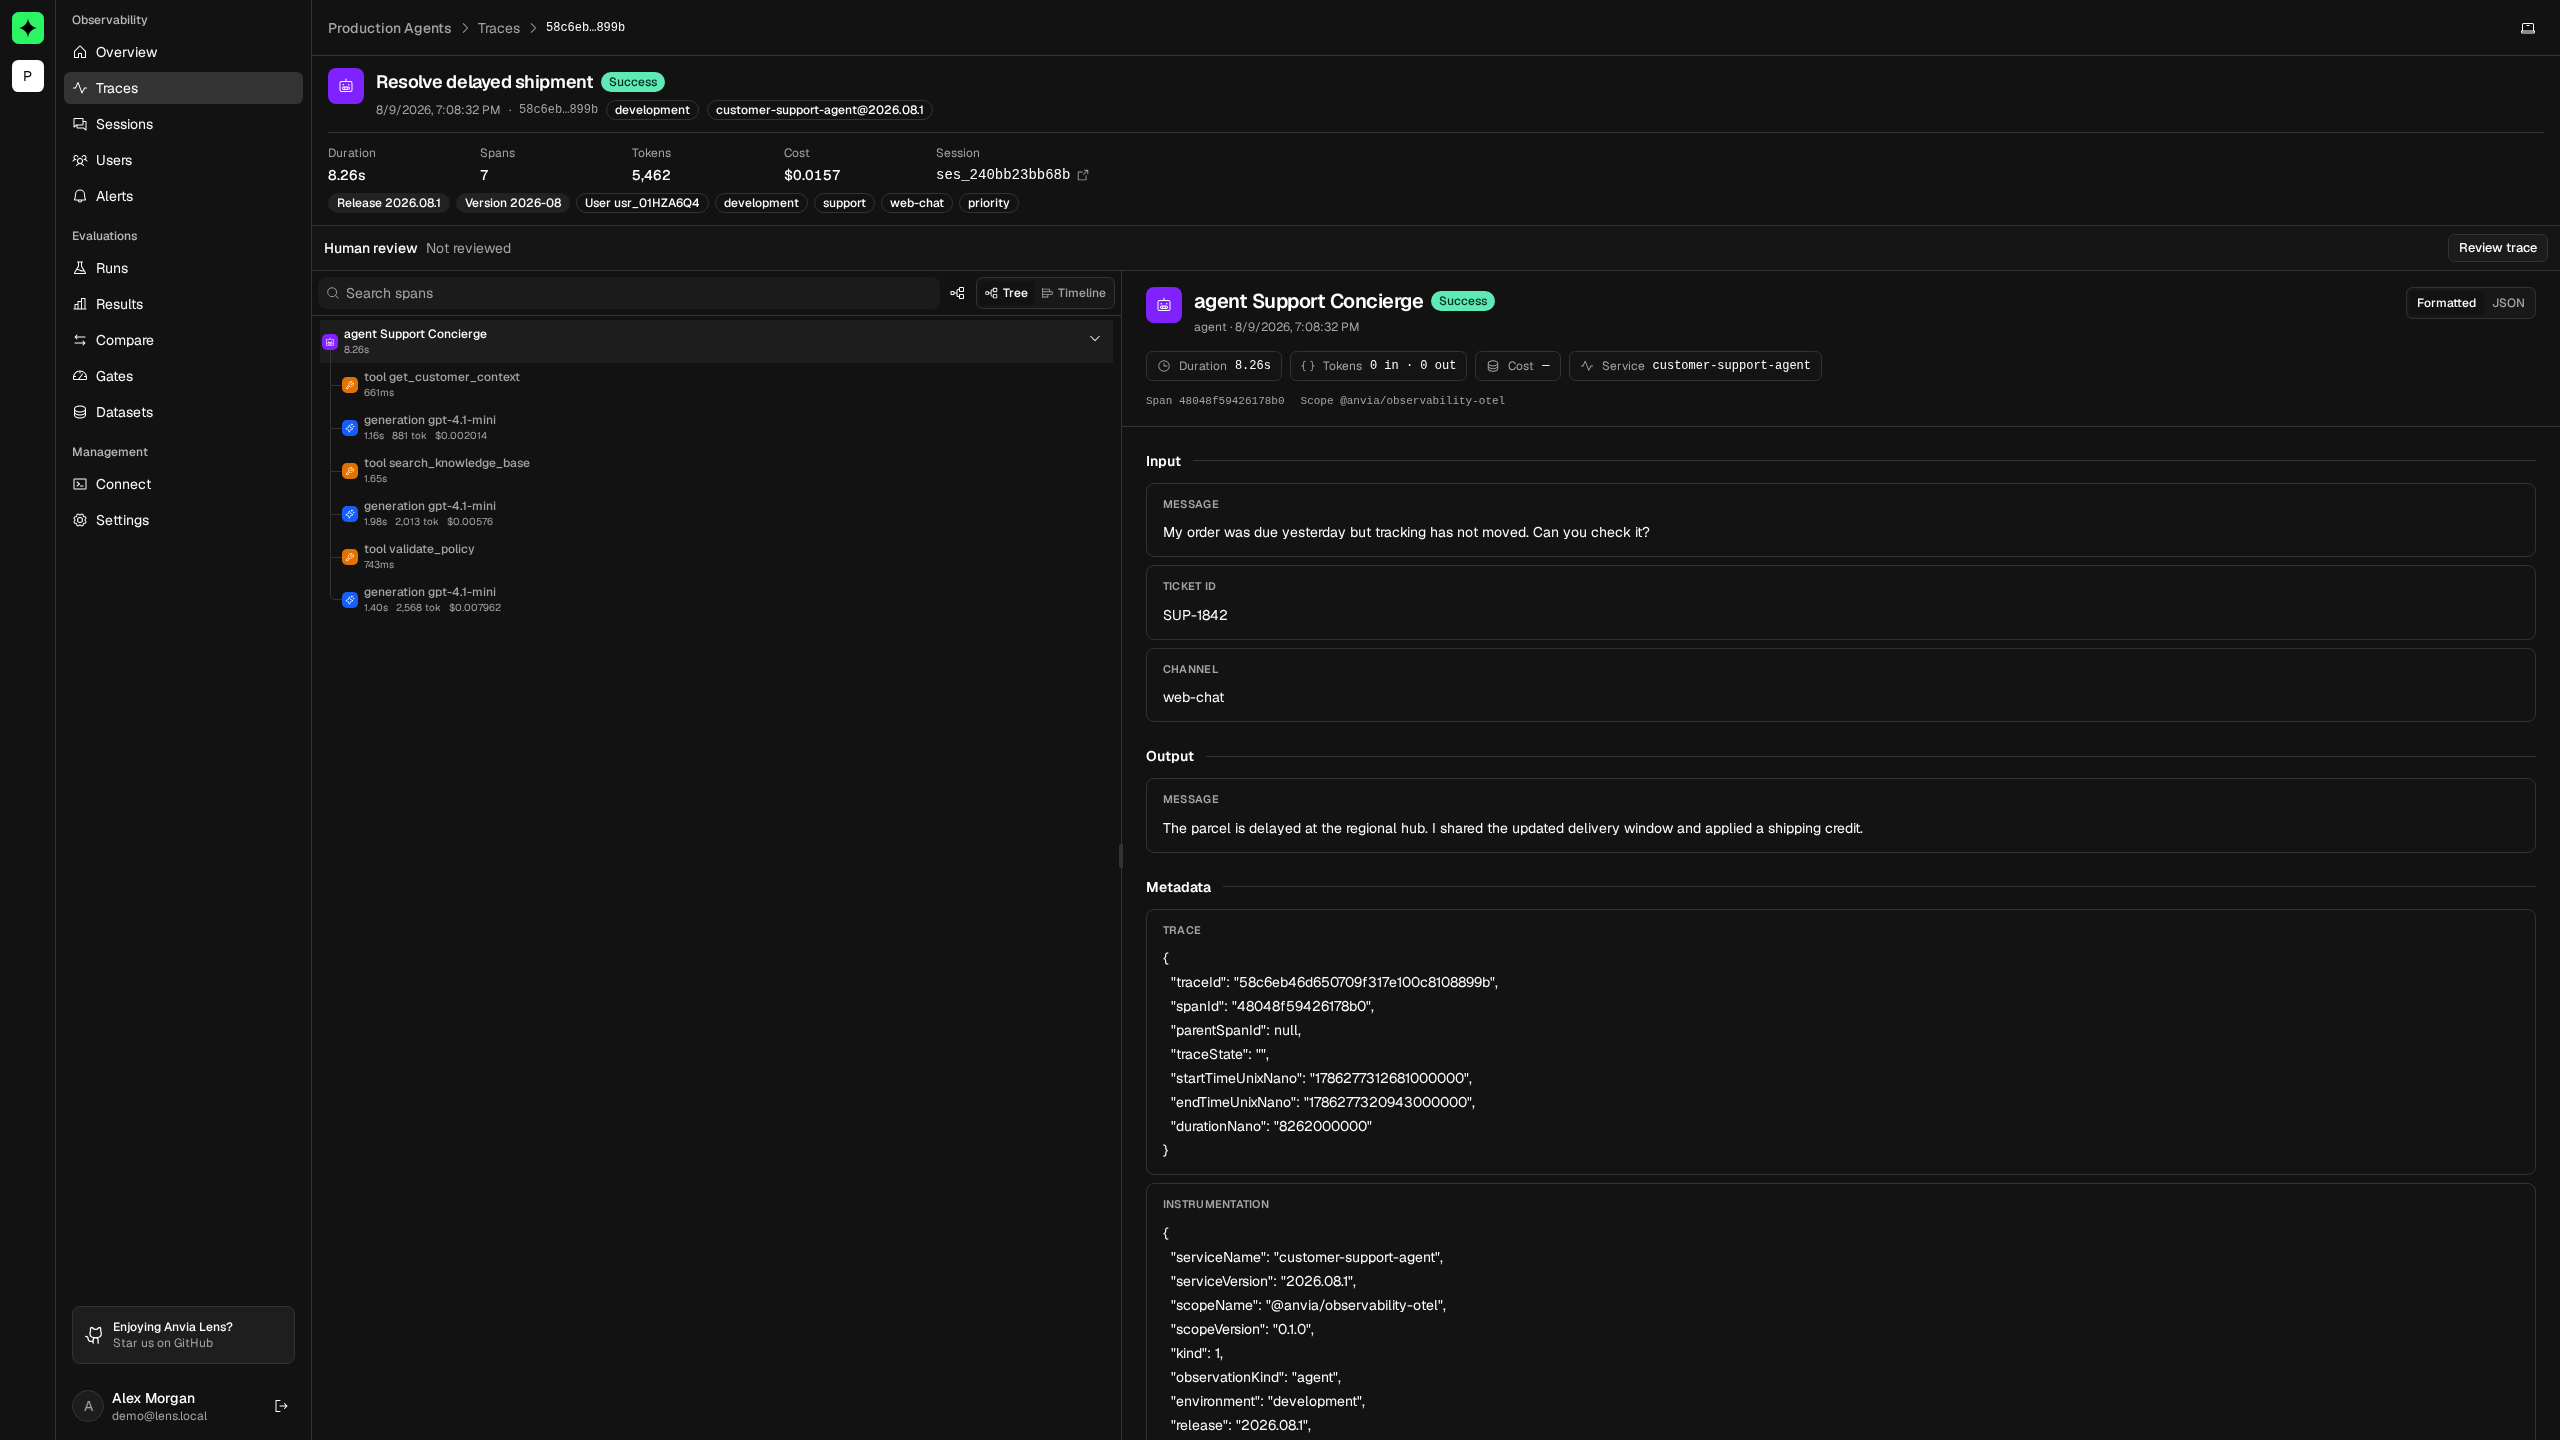
Read the trace summary
The header identifies the trace by name and ID and summarizes its status, start time, duration, span count, token usage, and cost. These values describe the whole trace; select a span for operation-level values.
Navigate the span tree
The tree preserves the exported parent-child relationships. Glyphs distinguish agents, generations, tools, evaluators, embeddings, retrieval work, and ordinary spans.
- Search spans by name.
- Expand or collapse a branch, or change the whole tree at once.
- Select a row to open that span in the inspector.
- Resize the navigation and inspector panels to suit the trace.
For a failed agent run, begin with the error-marked branch and work upward to see which parent operation owned it.
Use the timeline
Switch from Tree to Timeline to position spans relative to the full trace. Long bars expose slow operations; nesting shows which parent owned that time. Selecting a timeline bar opens the same span in the inspector.
A long tool span usually points to an external operation. A long generation span points toward model, prompt, or provider behavior. Parent duration can include child work, so inspect the longest relevant child before optimizing the parent.
Inspect captured data
The inspector reports the selected span's status and observation type, then shows available duration, token, cost, model, service, span ID, and parent ID values. Payload sections expose captured input, output, metadata, and error information.
Use the formatted view for conversational message content and raw JSON when exact serialization matters. Payloads can be absent because capture was disabled, redacted, omitted upstream, or removed by retention; identifiers and timing remain useful in those cases.
On narrow screens, tree, timeline, and data become separate tabs. Selecting a span moves to its data tab without changing the underlying trace.
To put several runs beside one another, continue with Compare traces. To label the trace outcome, see Trace reviews.