Observability
Lens turns runtime telemetry into an investigation workspace. Start on the project overview to find a change, move to a trace to locate the responsible model or tool call, and use sessions or users when the impact spans more than one request.
The overview is intentionally a summary. It answers what changed and where to look next; the trace explorer supplies the request-level evidence.
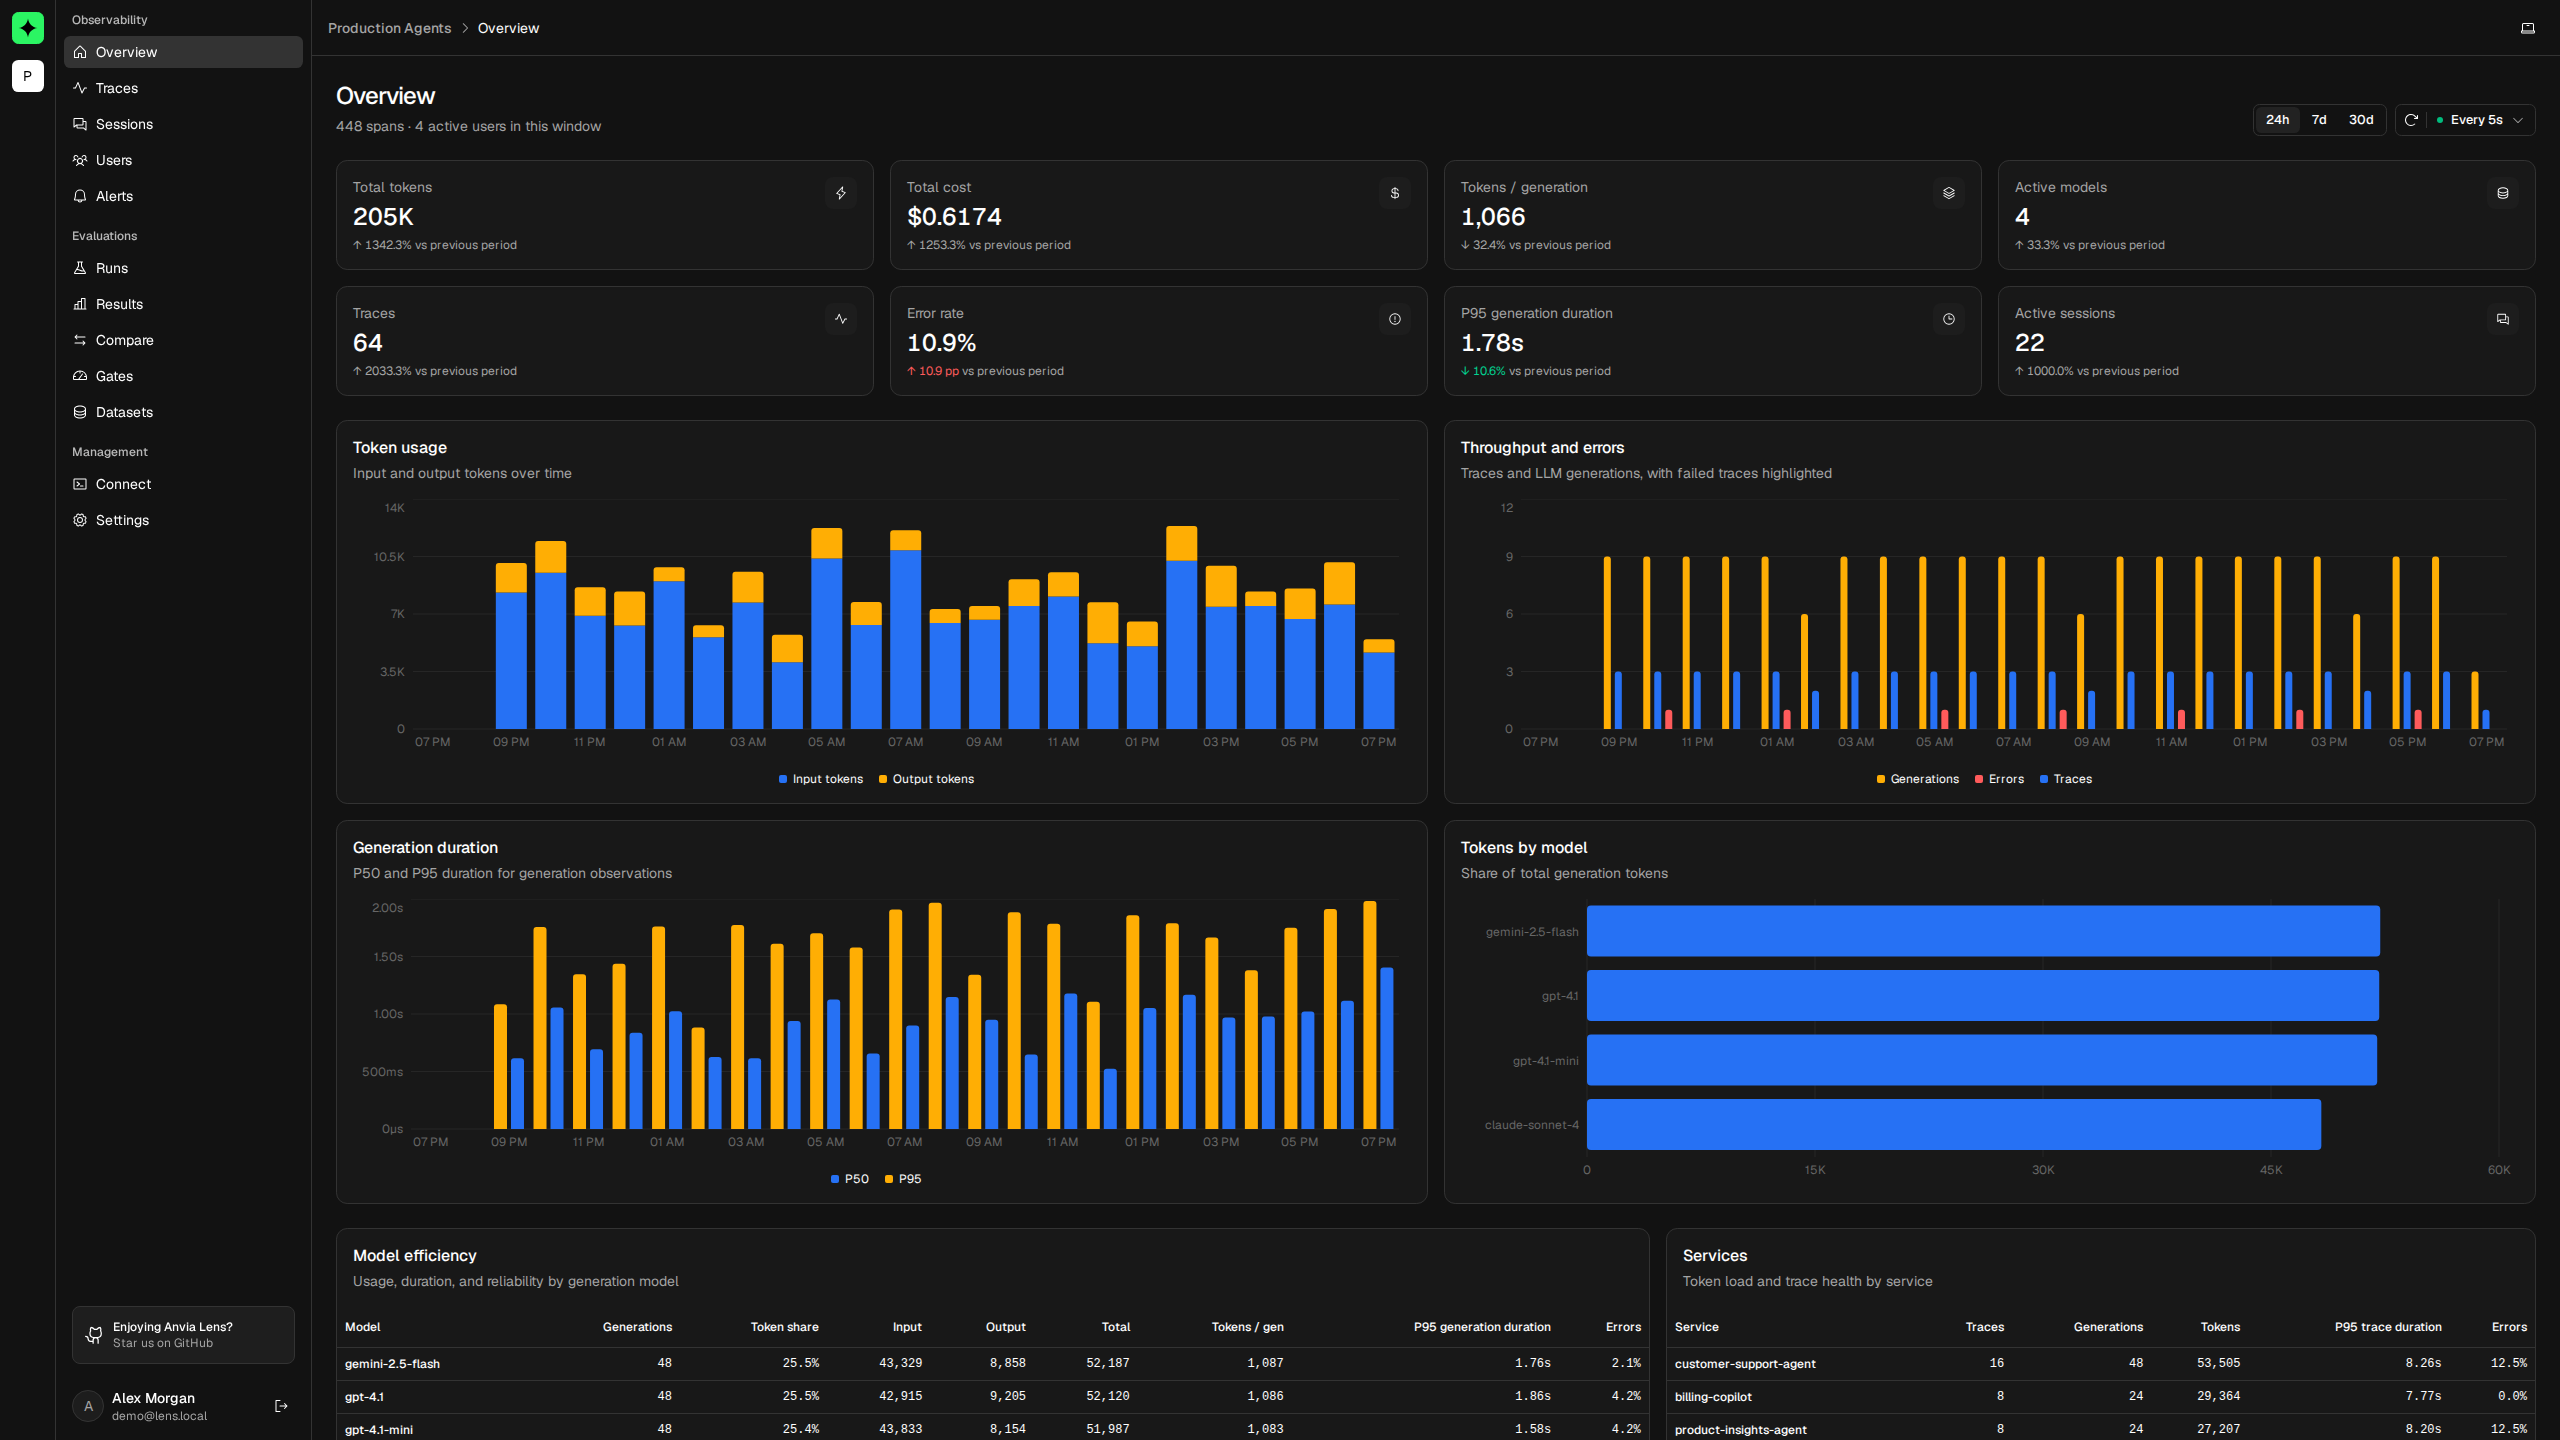
What the overview measures
Choose 24h, 7d, or 30d. Lens recalculates every card, chart, breakdown, and ranking for that window and compares the headline metrics with the immediately preceding window of the same length.
| Signal | What it tells you |
|---|---|
| Total tokens and cost | The overall model-usage load in the selected window. |
| Tokens per generation | Whether model calls are becoming larger on average. |
| Active models | How many distinct model names handled generation work. |
| Traces and error rate | Request volume and the share of traces that ended in error. |
| P95 generation duration | The duration under which 95% of generation observations completed. |
| Active sessions and users | How many supplied session and user identifiers were active. |
The comparison is directional, not a diagnosis. A 40% increase in duration can be caused by a busier model, a changed prompt, or a different request mix. Use the breakdowns and traces to determine which explanation is supported.
When Lens shows No prior baseline, it has current activity but insufficient data in the previous matching window.
Investigate a regression
Suppose response time increased after a deployment:
- Select the shortest range that contains the suspected deployment.
- Find when P95 generation duration rises in the duration chart.
- Check Model efficiency for a model with high P95 duration or error rate.
- Check Services to see whether the change is isolated to one emitting service.
- Open a model or service name to continue in the trace explorer with that filter already applied.
- Inspect a slow trace and its observation tree to locate the model, tool, or application span responsible.
Keep the same time range as you move between views. Otherwise, a breakdown and its underlying trace list may describe different traffic.
Read the charts
The overview separates four questions:
- Token usage stacks input and output tokens over time.
- Throughput and errors shows traces, generation calls, and failed traces.
- Generation duration compares P50 with P95 latency. A widening gap indicates a slower tail even when the typical call is stable.
- Tokens by model shows which model names account for the largest share of generation tokens.
Ranges use different chart buckets: hourly for 24 hours, six-hour buckets for 7 days, and daily buckets for 30 days. Empty buckets remain visible so a quiet period is not mistaken for missing data.
Use the operational breakdowns
The lower cards help decide where to drill down:
- Model efficiency combines generation count, token share, tokens per generation, P95 duration, and model error rate.
- Services compares trace volume, generations, tokens, P95 trace duration, and error rate by service name.
- Tool health ranks frequently used tool observations with call volume, P95 call duration, and error rate.
- Token-heavy traces points to the five largest traces by token use.
- Recent failures points to the five latest failed traces.
Model and service rows link to filtered traces. Tool health is a directional signal; open Traces and inspect the relevant observation trees when you need tool arguments, results, or error details.
Refresh live activity
Use the live control to refresh immediately or choose an automatic interval. Fast refresh is useful while verifying a new integration. For historical analysis, turn it off so the selected population does not move while you compare values.
If no activity appears, send a traced request, flush the exporter when running a short-lived process, and verify the project credentials. Start with Your first trace for a complete check.
Know what context is required
Lens can calculate trace, span, duration, error, and token metrics without captured prompt bodies. Other views depend on context supplied by the application:
| To populate | Supply |
|---|---|
| Sessions | A stable sessionId on related traces. |
| Users | A stable userId on each relevant trace. |
| Environment or release investigation | Explicit environment and immutable release values. |
| Cost | Provider-reported cost or configured model pricing with token counts. |
Add these values at the request boundary described in Trace context. Use Sessions for one conversation, Users for activity across conversations, and Costs when model pricing needs correction.