Runtime status
Studio's Status page summarizes what the current Studio process has registered and which development surfaces it can expose. Use it to verify wiring—targets, stores, explicit sandbox registrations, and feature availability—without digging through the process at runtime.
Open http://localhost:4021/status in the browser console. To read the raw JSON instead, request the same path with an API client; the browser console itself fetches GET /status and renders that payload.
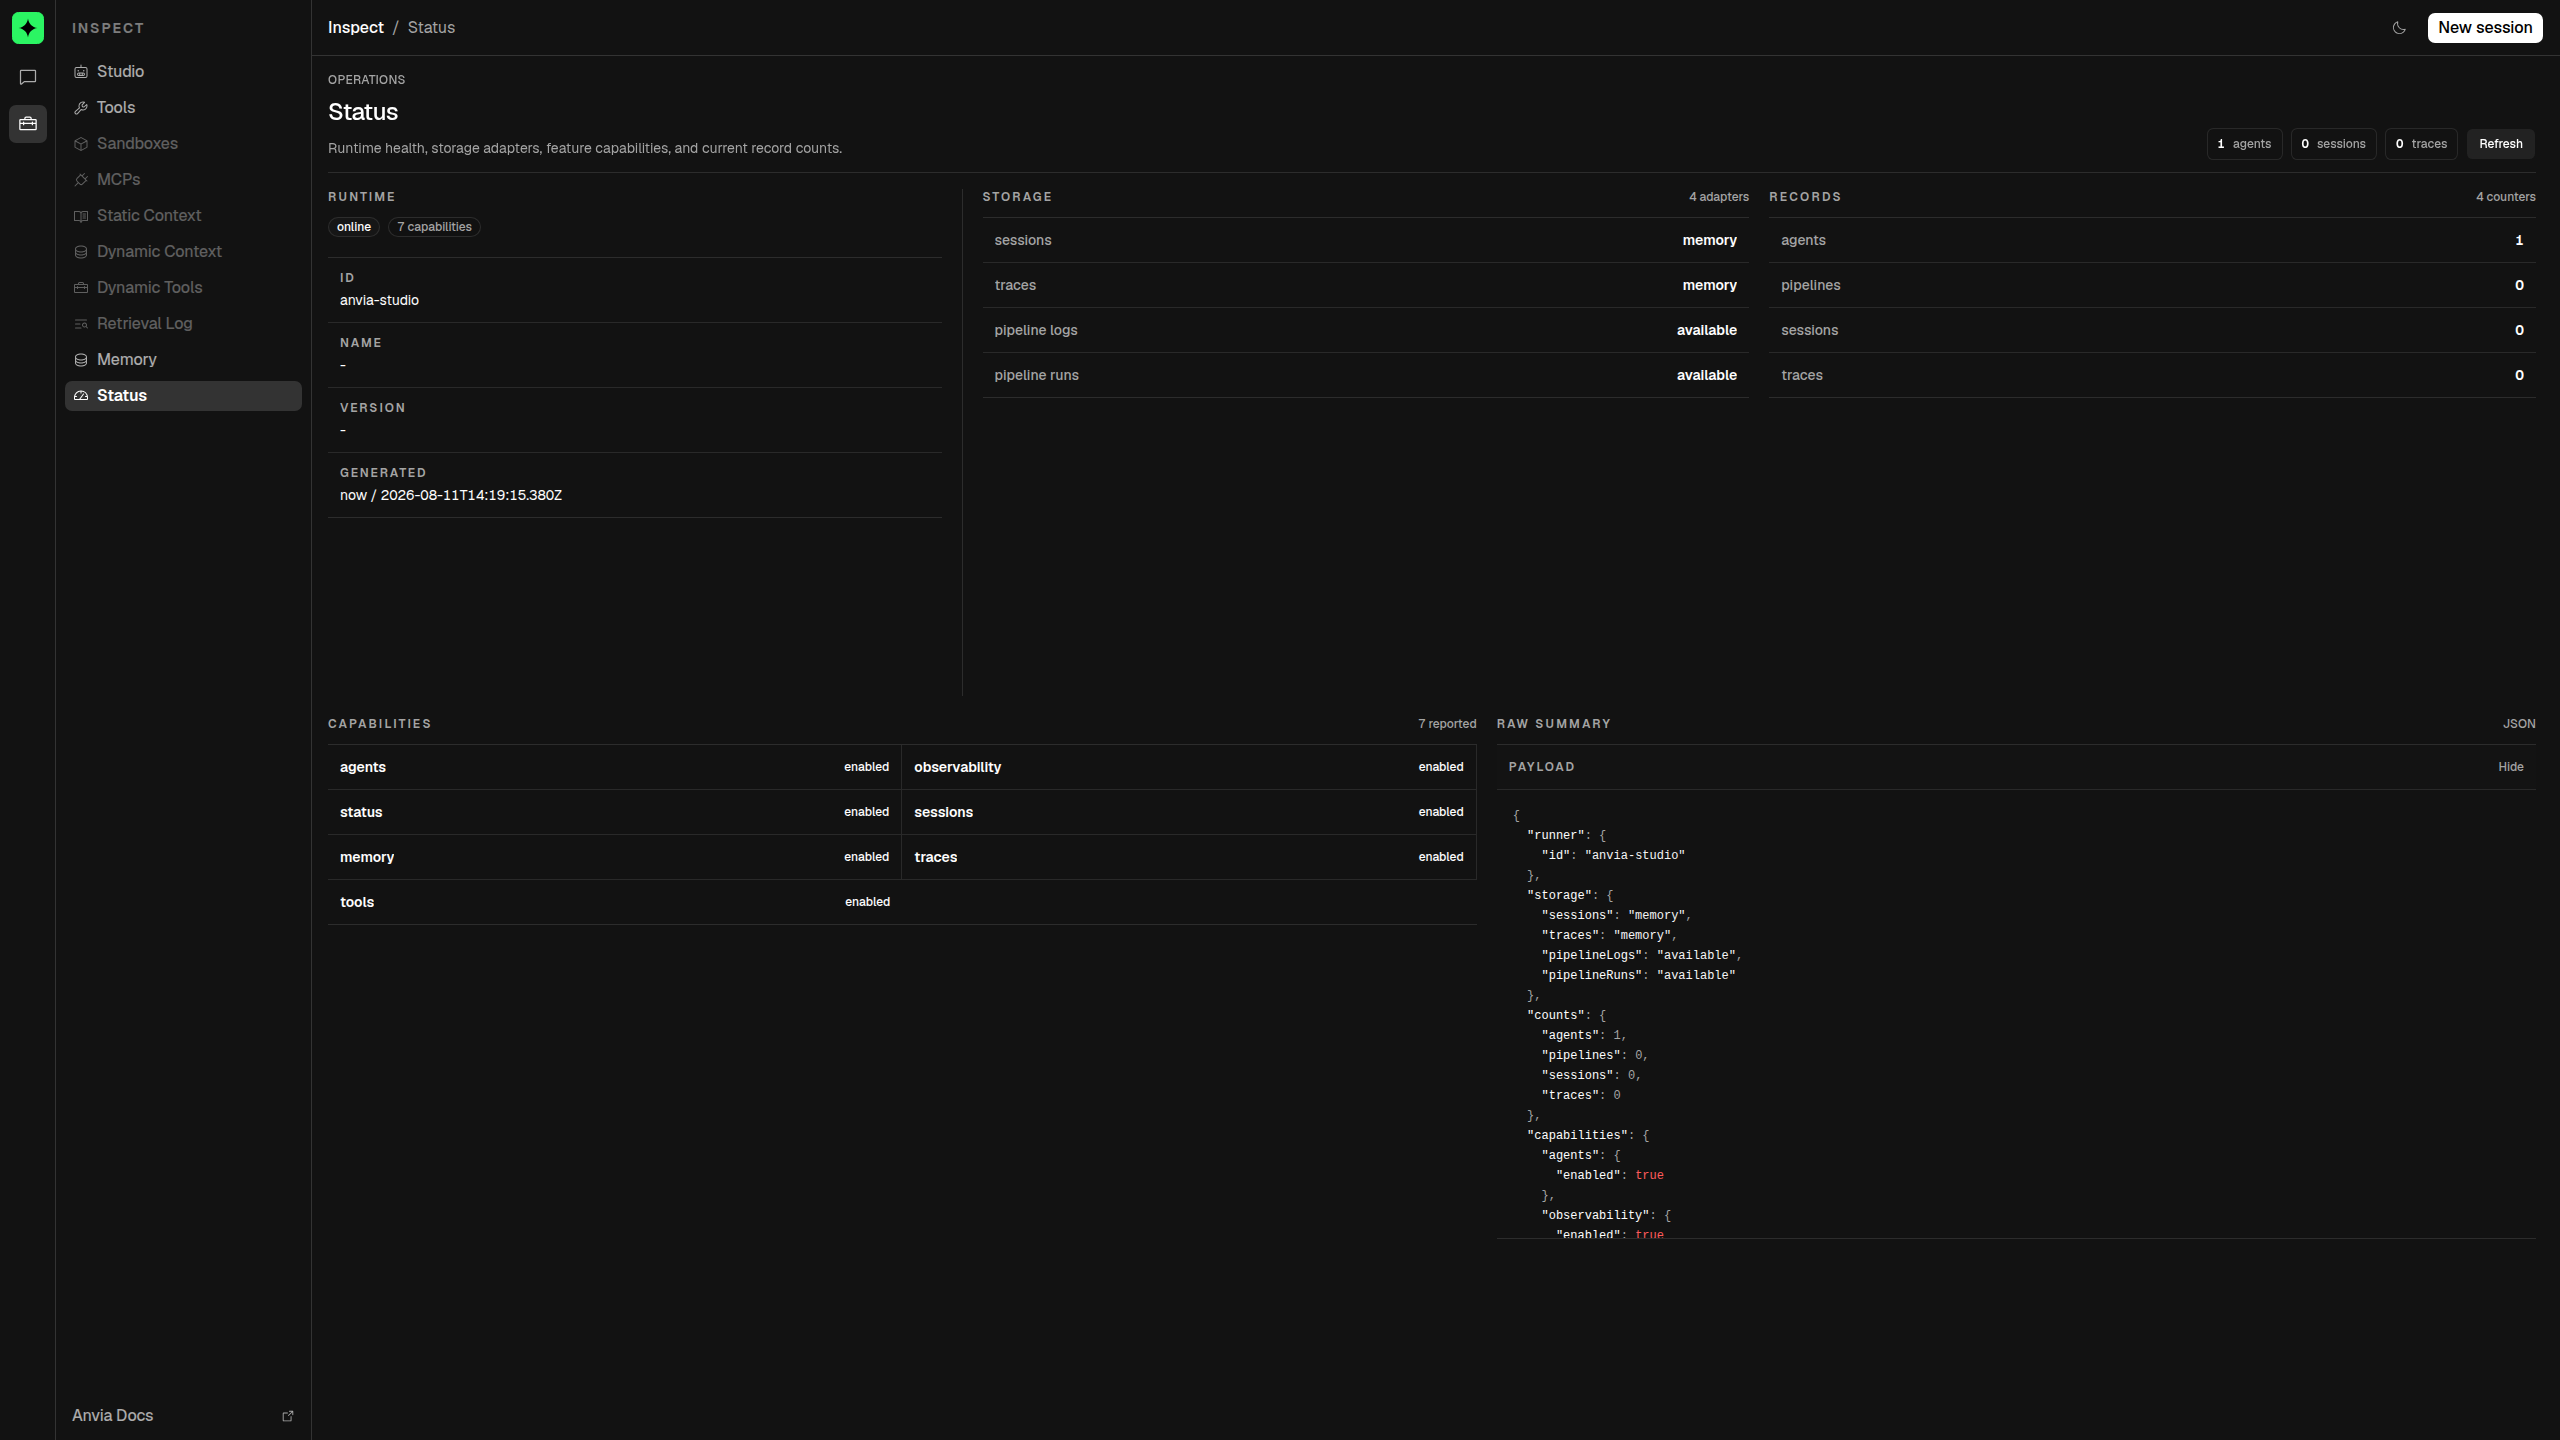
What the summary means
The status payload has five parts:
| Field | Meaning |
|---|---|
runner | Studio runtime identity. The public Studio entry point currently reports anvia-studio unless a lower-level runtime supplies another identity. |
storage | The resolved session and trace adapter kinds, plus availability of pipeline log and run stores. |
counts | Registered targets and the records visible through configured stores. |
capabilities | Development features enabled by the current targets and stores. |
generatedAt | When Studio generated this particular snapshot. |
The page does not continuously stream this data. Select Refresh to request a new snapshot.
Read the storage section
Studio resolves stores when the runtime is created. With default options, it creates an in-memory store for sessions, traces, pipeline logs, and pipeline runs.
new Studio([agent]).start({ port: 4021 })The default status reports the in-memory adapter kinds for sessions and traces, and reports pipeline logs and pipeline runs as available. These values describe configured adapters; they do not mean the records will survive a restart.
To make the development history durable, provide the SQLite adapter explicitly:
import { createSqliteSessionStore, Studio } from '@anvia/studio'

const store = createSqliteSessionStore({
  path: '.anvia-studio/studio.sqlite',
})

new Studio([agent, pipeline], {
  stores: {
    sessions: store,
    traces: store,
    pipelineLogs: store,
    pipelineRuns: store,
  },
}).start({ port: 4021 })
The SQLite adapter implements all four interfaces. The status payload reports its kind for sessions and traces; pipeline log and run storage are currently reported only as available, not by adapter name.
Understand the counters
agents and pipelines are exact counts of the targets registered in this process. sandboxes, when present, is the number of inspectors supplied through StudioOptions.sandboxes.
Stored record counters are lightweight summaries rather than database totals:
sessionsreads at most 100 recent sessions;tracesreads at most 100 traces and is present only when the trace store supports global listing;pipelineRunssums at most 100 runs for each registered pipeline;- absent optional counters are omitted rather than reported as zero.
For large persistent stores, treat these values as bounded visibility checks. They are not analytics metrics or authoritative cardinality queries.
Understand capabilities
Capabilities reflect current registration and adapter availability:
| Capability | Enabled when |
|---|---|
agents, observability, status | Always exposed by the Studio runtime. |
sessions | A session store is resolved. |
memory | A session store exists or at least one agent has memory configured. |
traces | A trace store is resolved. |
pipelines | At least one pipeline is registered. |
evals | At least one evaluation suite is registered. |
tools | An agent has static or dynamic tools. |
mcps | An agent has a tool carrying MCP server provenance. |
sandboxes | At least one sandbox inspector is explicitly registered. |
interactions | An agent has an approval-capable tool or a question tool. |
knowledge | An agent has static context, dynamic context, or dynamic tools. |
The map contains discovered, enabled capabilities. A missing entry usually means the required target or adapter was not registered; it does not necessarily indicate an error.
Studio's configuration endpoint makes explicitly unsupported core surfaces visible:
curl http://127.0.0.1:4021/configIts unsupportedCapabilities array currently identifies sessions and traces when their stores are unavailable. Calls to those unsupported route families return an unsupported_capability response. Other optional features are simply absent from the capability map when no matching target exists.
Raw status example
curl http://127.0.0.1:4021/statusA small agent-only development runtime can return a payload shaped like this:
{
  "runner": {
    "id": "anvia-studio"
  },
  "storage": {
    "sessions": "memory",
    "traces": "memory",
    "pipelineLogs": "available",
    "pipelineRuns": "available"
  },
  "counts": {
    "agents": 1,
    "pipelines": 0,
    "sessions": 3,
    "traces": 3
  },
  "capabilities": {
    "agents": { "enabled": true },
    "observability": { "enabled": true },
    "status": { "enabled": true },
    "sessions": { "enabled": true },
    "memory": { "enabled": true },
    "traces": { "enabled": true }
  },
  "generatedAt": "2026-08-11T08:30:00.000Z"
}
The exact storage, counts, and capabilities fields depend on the registered runtime. The UI includes an expandable Raw summary panel so you can compare its rendering with the API payload.
Status is not dependency health
The status endpoint does not ping model providers, execute a database probe, contact MCP servers, test published ports, or verify that an agent can complete a prompt. A store name means that an adapter was resolved, and an enabled capability means that Studio registered the corresponding surface.
Studio also exposes:
GET /healthThat endpoint returns status: "ok" when the Studio HTTP process can answer the request, together with the runner identity. It is a liveness response, not a readiness check for providers, databases, tools, sandboxes, or external dependencies.
For deeper debugging:
| Question | Use |
|---|---|
| Did this local run call the expected model and tools? | Traces |
| Did Studio preserve the conversation and runtime logs? | Sessions |
| Is an agent configured with the expected model, tools, memory, and lifecycle policy? | Agents |
| Is a sandbox still available and what is running inside it? | Sandboxes |
| What happened across deployed environments over time? | Lens |
Treat Status as a local development wiring summary. Use dedicated application health checks and observability for production operations.