Pipelines
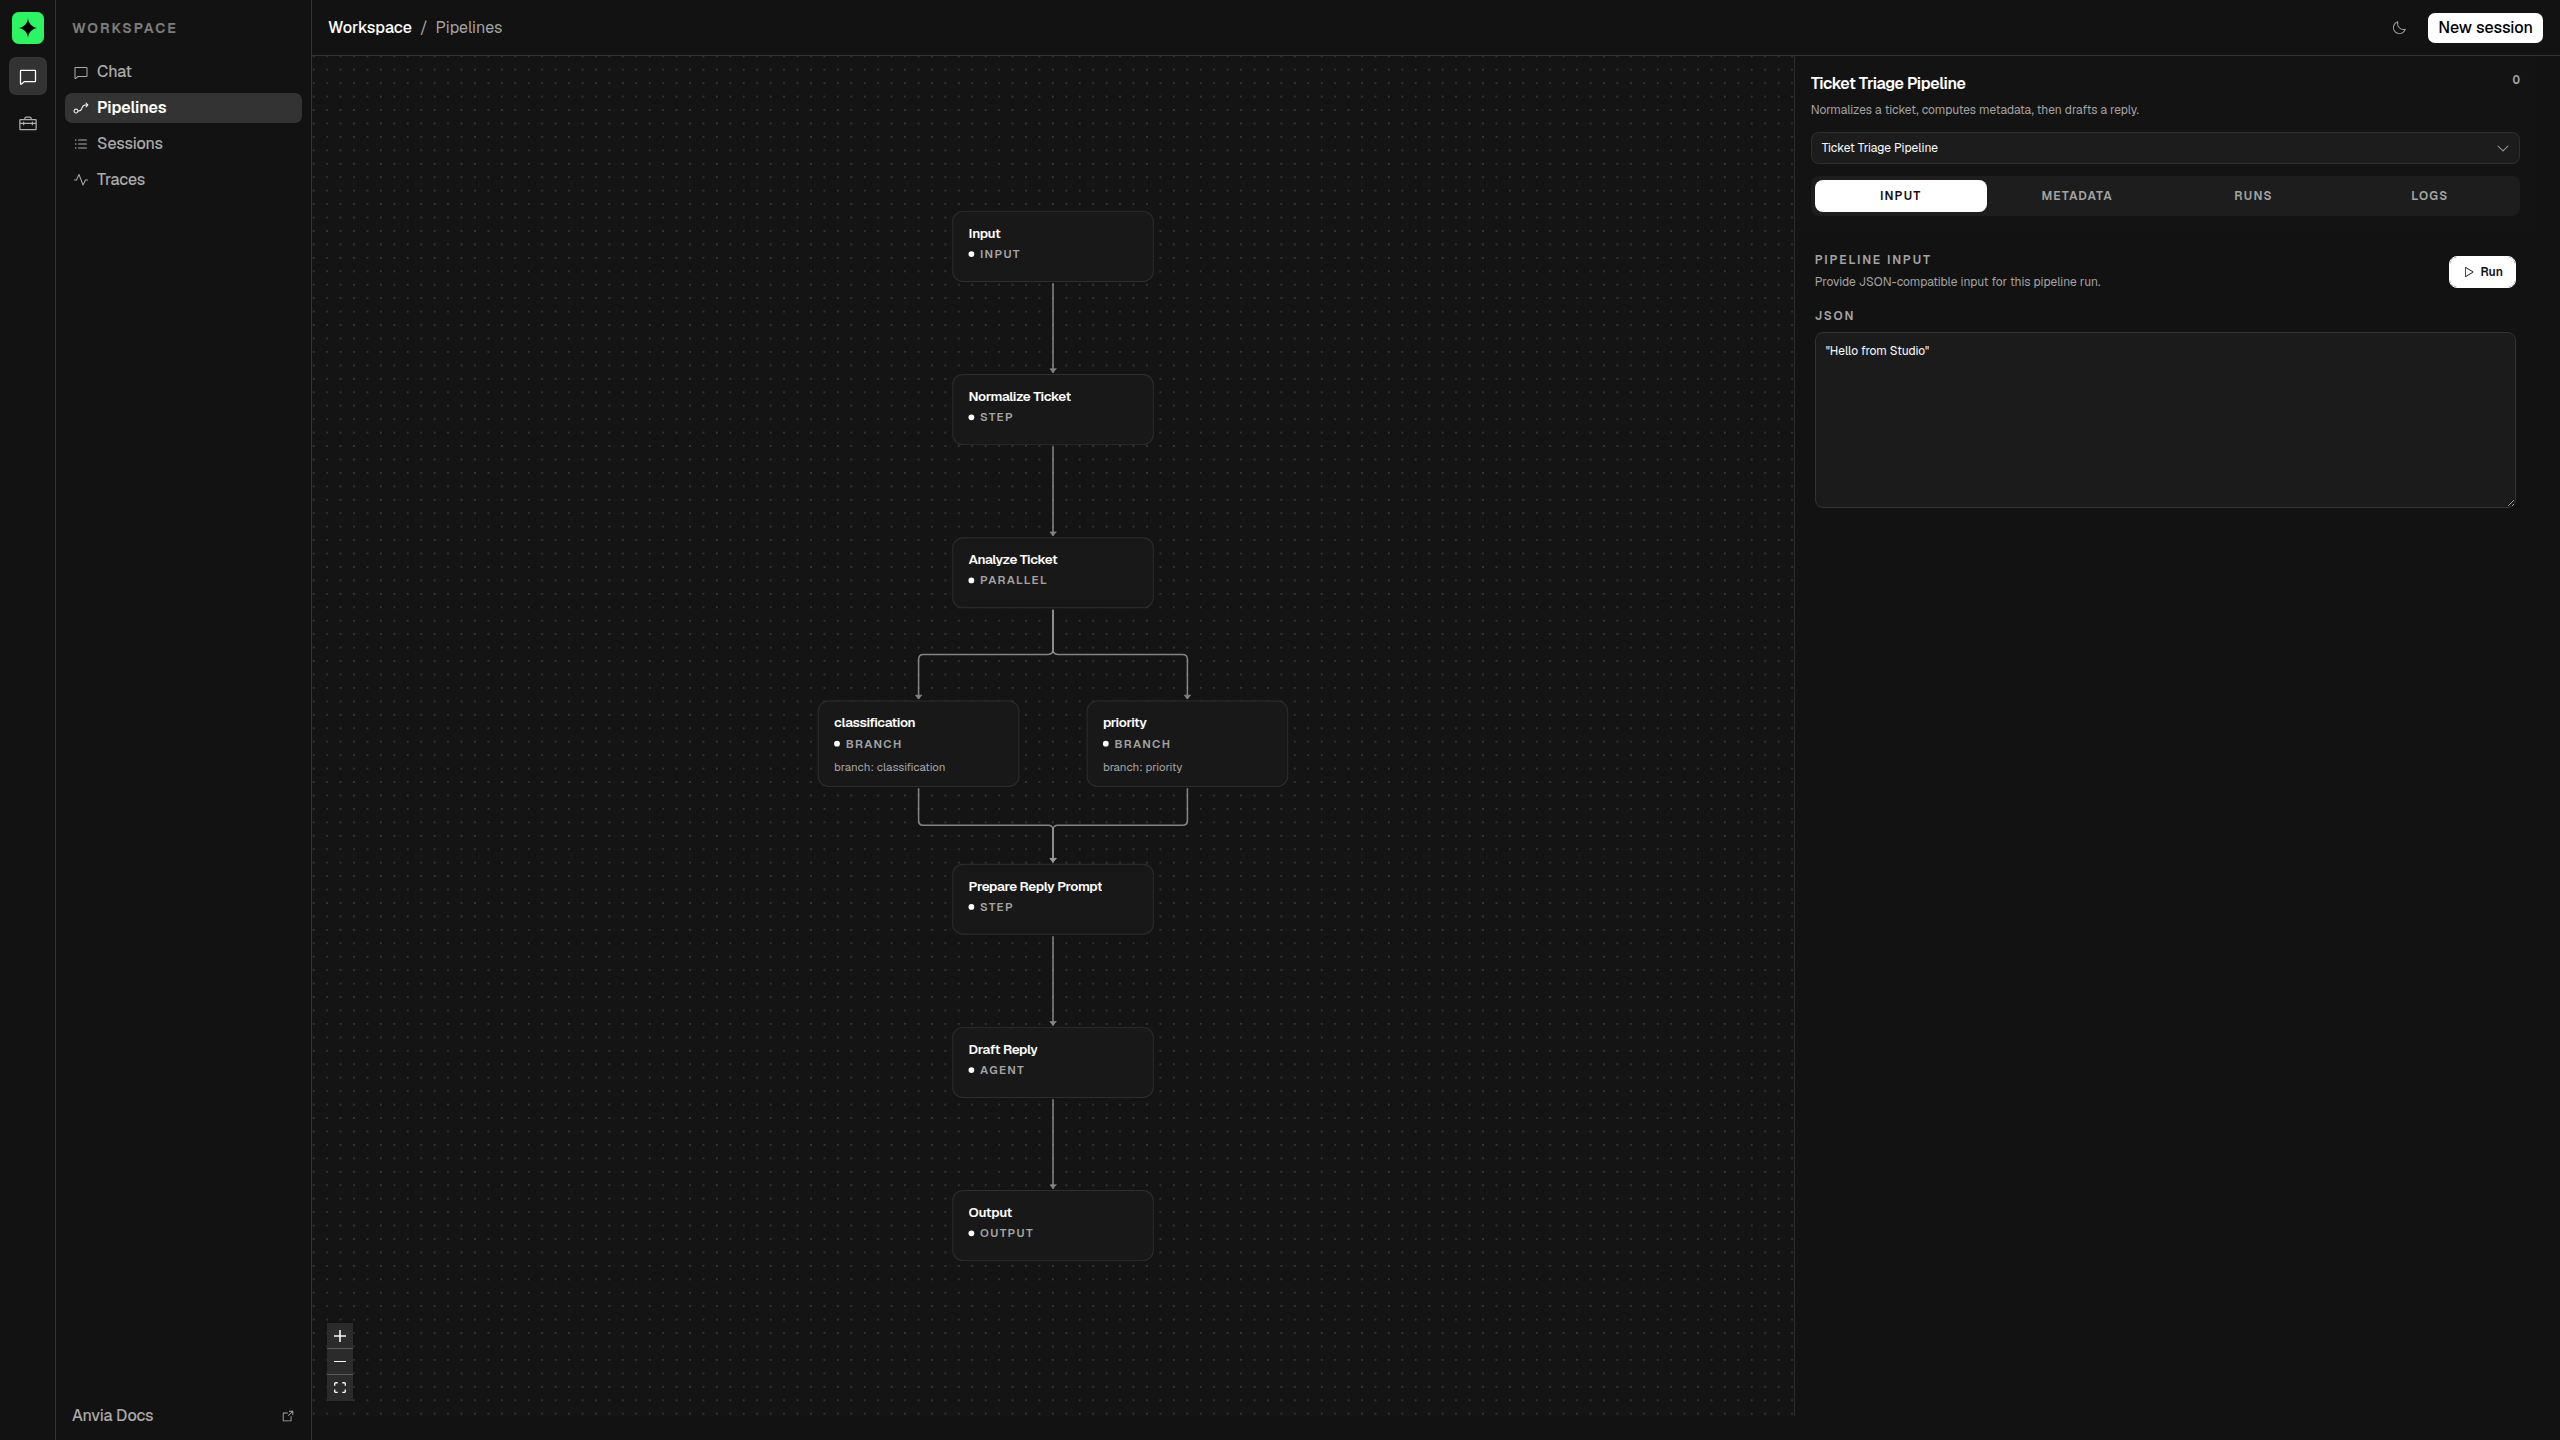
Studio turns an Anvia pipeline into a runnable development surface. Register a pipeline once, then use the browser to inspect its graph, supply input, watch stages change state, read runtime logs, and rerun saved inputs.
Studio does not replace the pipeline API. Build and type the workflow with Pipeline; use Studio to understand how that workflow behaves while you develop it.
Register a pipeline
Pass built pipelines alongside any agents that Studio should expose:
import { Pipeline } from '@anvia/core/pipeline';
import { Studio } from '@anvia/studio';
import { z } from 'zod';
const ticketPipeline = new Pipeline({
    id: 'ticket-triage-pipeline',
    name: 'Ticket triage',
    description: 'Normalizes a ticket and prepares a routing decision.',
    metadata: { owner: 'support-operations' },
    inputSchema: z.string(),
})
    .step({
    id: 'normalize-ticket',
    name: 'Normalize ticket',
    run: ({ input: ticket }) => ticket.trim()
})
    .step({
    id: 'classify-priority',
    name: 'Classify priority',
    run: ({ input: ticket }) => ({
        ticket,
        priority: ticket.toLowerCase().includes('outage') ? 'high' : 'normal',
    })
});
new Studio([ticketPipeline]).start({ port: 4021 });
Open http://localhost:4021/ui/pipelines. The Pipelines item remains available even when no pipeline is registered; in that case Studio shows an empty state explaining what to configure.
You can register several pipelines, or mix pipelines and agents in the same target list:
new Studio([
  supportAgent,
  orderStatusPipeline,
  ticketRoutingPipeline,
]).start()
Use a stable, descriptive pipeline id. Studio uses it to address the pipeline, associate logs and runs, and locate the original input during replay.
The Studio workflow
Select pipeline
      ↓
Inspect graph and node metadata
      ↓
Enter JSON-compatible input
      ↓
Run and watch stage state
      ↓
Inspect output, logs, and saved run
      ↓
Change the implementation or rerun the saved input
The pipeline inspector has four tabs:
| Tab | What it shows |
|---|---|
| Input | A JSON editor and the control that starts a run. |
| Metadata | Graph counts plus details for the selected node. |
| Runs | Saved run status, timing, output or error, and the Rerun action. |
| Logs | Ordered pipeline and stage lifecycle events. |
Choose the next page
| Goal | Page |
|---|---|
| Understand the graph, node details, and JSON input rules | Graph and inputs |
| Inspect stage events, outputs, failures, persistence, and replay | Runs, logs, and replay |
| Learn how to construct typed pipelines | Anvia SDK pipelines |
Studio is most useful for a pipeline with meaningful stage names and descriptions. They become the labels and explanations in the inspector, so operational names such as Load account or Draft response are more useful than generic names such as Step 2.